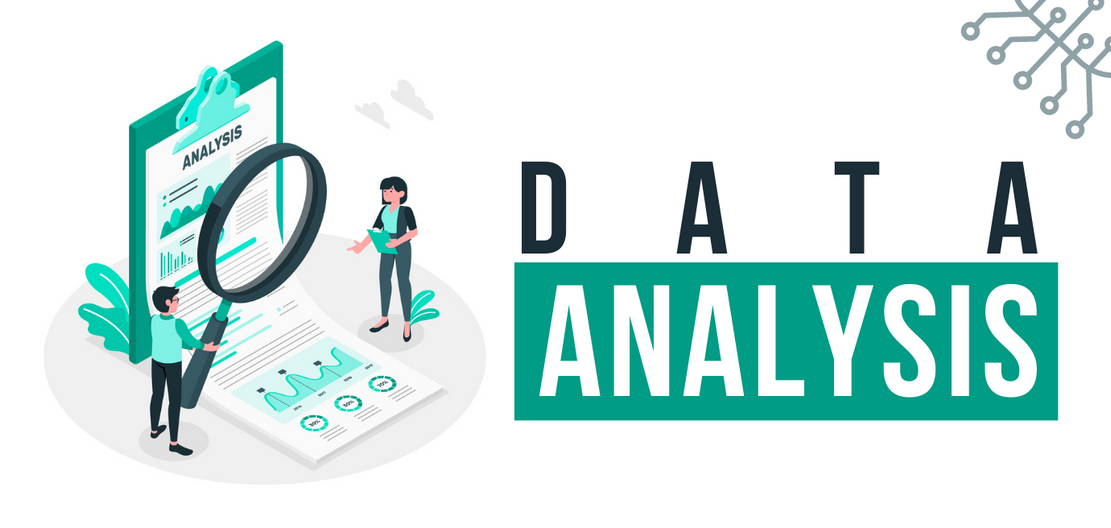
Unlock the Power of Data with Our Comprehensive Data Analysis Course
The data analysis course is a comprehensive program designed to teach participants the
skills necessary to effectively analyze, interpret, and communicate insights from various
types of data sets. This course covers a wide range of topics, including data cleaning, data
exploration, data visualization, statistical analysis, and machine learning. By the end of
the course, you will be able to identify patterns and trends, make data-driven decisions,
and communicate insights to stakeholders effectively. Whether you work in marketing,
finance, healthcare, or any other industry that relies on data, this course will provide you
with the necessary skills to succeed. Don't miss out on this opportunity to enhance your
data analysis skills.
Enroll now and take your career to the next level.
Duration
2 Months
Learning Options:
On-Campus
Course Fee
₦200,000
Prerequisite
None
Next Start Date
13th October 2025
Certification
AfriHUB Certified Data Analyst
Course Outline
Introduction to Data Transformation with Power Query
This module introduces Power Query, a versatile ETL (Extract, Transform, Load) tool used for data extraction from various sources into Power BI and Excel. Participants will learn how to use Power Query to manipulate and transform data.
Pivot Tables and Advanced Pivot Tables
This module covers Pivot Tables and includes an optional section for those who are not familiar with them. Participants will learn to create and work with Pivot Tables. It also introduces the concept of "Power" Pivot Tables, which are connected to the Power BI and Excel Data Model for more advanced data analysis.
Data Analysis Expressions (DAX)
In this module, participants will delve into Data Analysis Expressions (DAX), a powerful formula language. DAX is used for creating complex calculations and performing advanced data analysis tasks within Power BI and Excel.
Data Visualization and Dynamic Dashboards
This module focuses on powerful data visualization techniques and dynamic dashboard creation in Power BI and Excel. Participants will learn to use features like Slicers and Timelines to create interactive and informative visualizations and dashboards.